Within IR Glare
When Infrared Saturation Erases the Real Shape
A strong infrared signal can exceed a camera's useful range and preserve brightness while losing trustworthy edge detail.
On this page
- What saturation does to a hot target
- Why brightness survives after shape information fails
- Clues that a displayed edge is not physical
Page outline Jump by section
Introduction
A strong infrared return can remain conspicuously bright while ceasing to be a trustworthy picture of the object that produced it. The key failure mode is saturation: part of the detector or imaging chain reaches its upper useful limit, so further increases in incoming infrared radiation no longer produce proportionate, information-rich pixel values. Teledyne FLIR explicitly warns that excessive radiation can exceed a thermal imager’s saturation limit, while US Department of Homeland Security guidance notes that objects outside an imager’s dynamic range can collapse towards the same displayed intensity.[FLIR Customer Support]flir.custhelp.comFLIR Customer Support FLIR CamerasFLIR Customer SupportFLIR Cameras - Saturation Limit of a Thermal ImagerOctober 7, 2024…
For UFO and UAP footage, that distinction matters. A saturated white-hot or black-hot patch may reliably indicate a strong infrared signal, yet its displayed boundary need not reproduce the target’s physical outline. Laboratory work on infrared detector arrays shows an additional complication: beyond saturation, signal can spread into neighbouring pixels through blooming, making bright sources appear larger.[Sandia National Laboratories]sandia.govSandia National LaboratoriesSimulation and experimental characterization of the point spread function, pixel saturation, and blooming of…
What saturation does to a hot target
A thermal camera has a finite dynamic range. At the detector level, there is a maximum signal that a pixel can accommodate or meaningfully encode; elsewhere in the imaging chain there are also limits imposed by gain, analogue electronics and digitisation. Research on thermal-imaging metrology describes dynamic range in terms of the interval between the weakest useful signal and the maximum signal associated with pixel full-well capacity.[PubMed Central (PMC)]pmc.ncbi.nlm.nih.govPubMed Central (PMC)Thermal Imaging Metrology Using High Dynamic Range Near-Infrared Photovoltaic-Mode Camera - PMCSeptember 13, 2021…
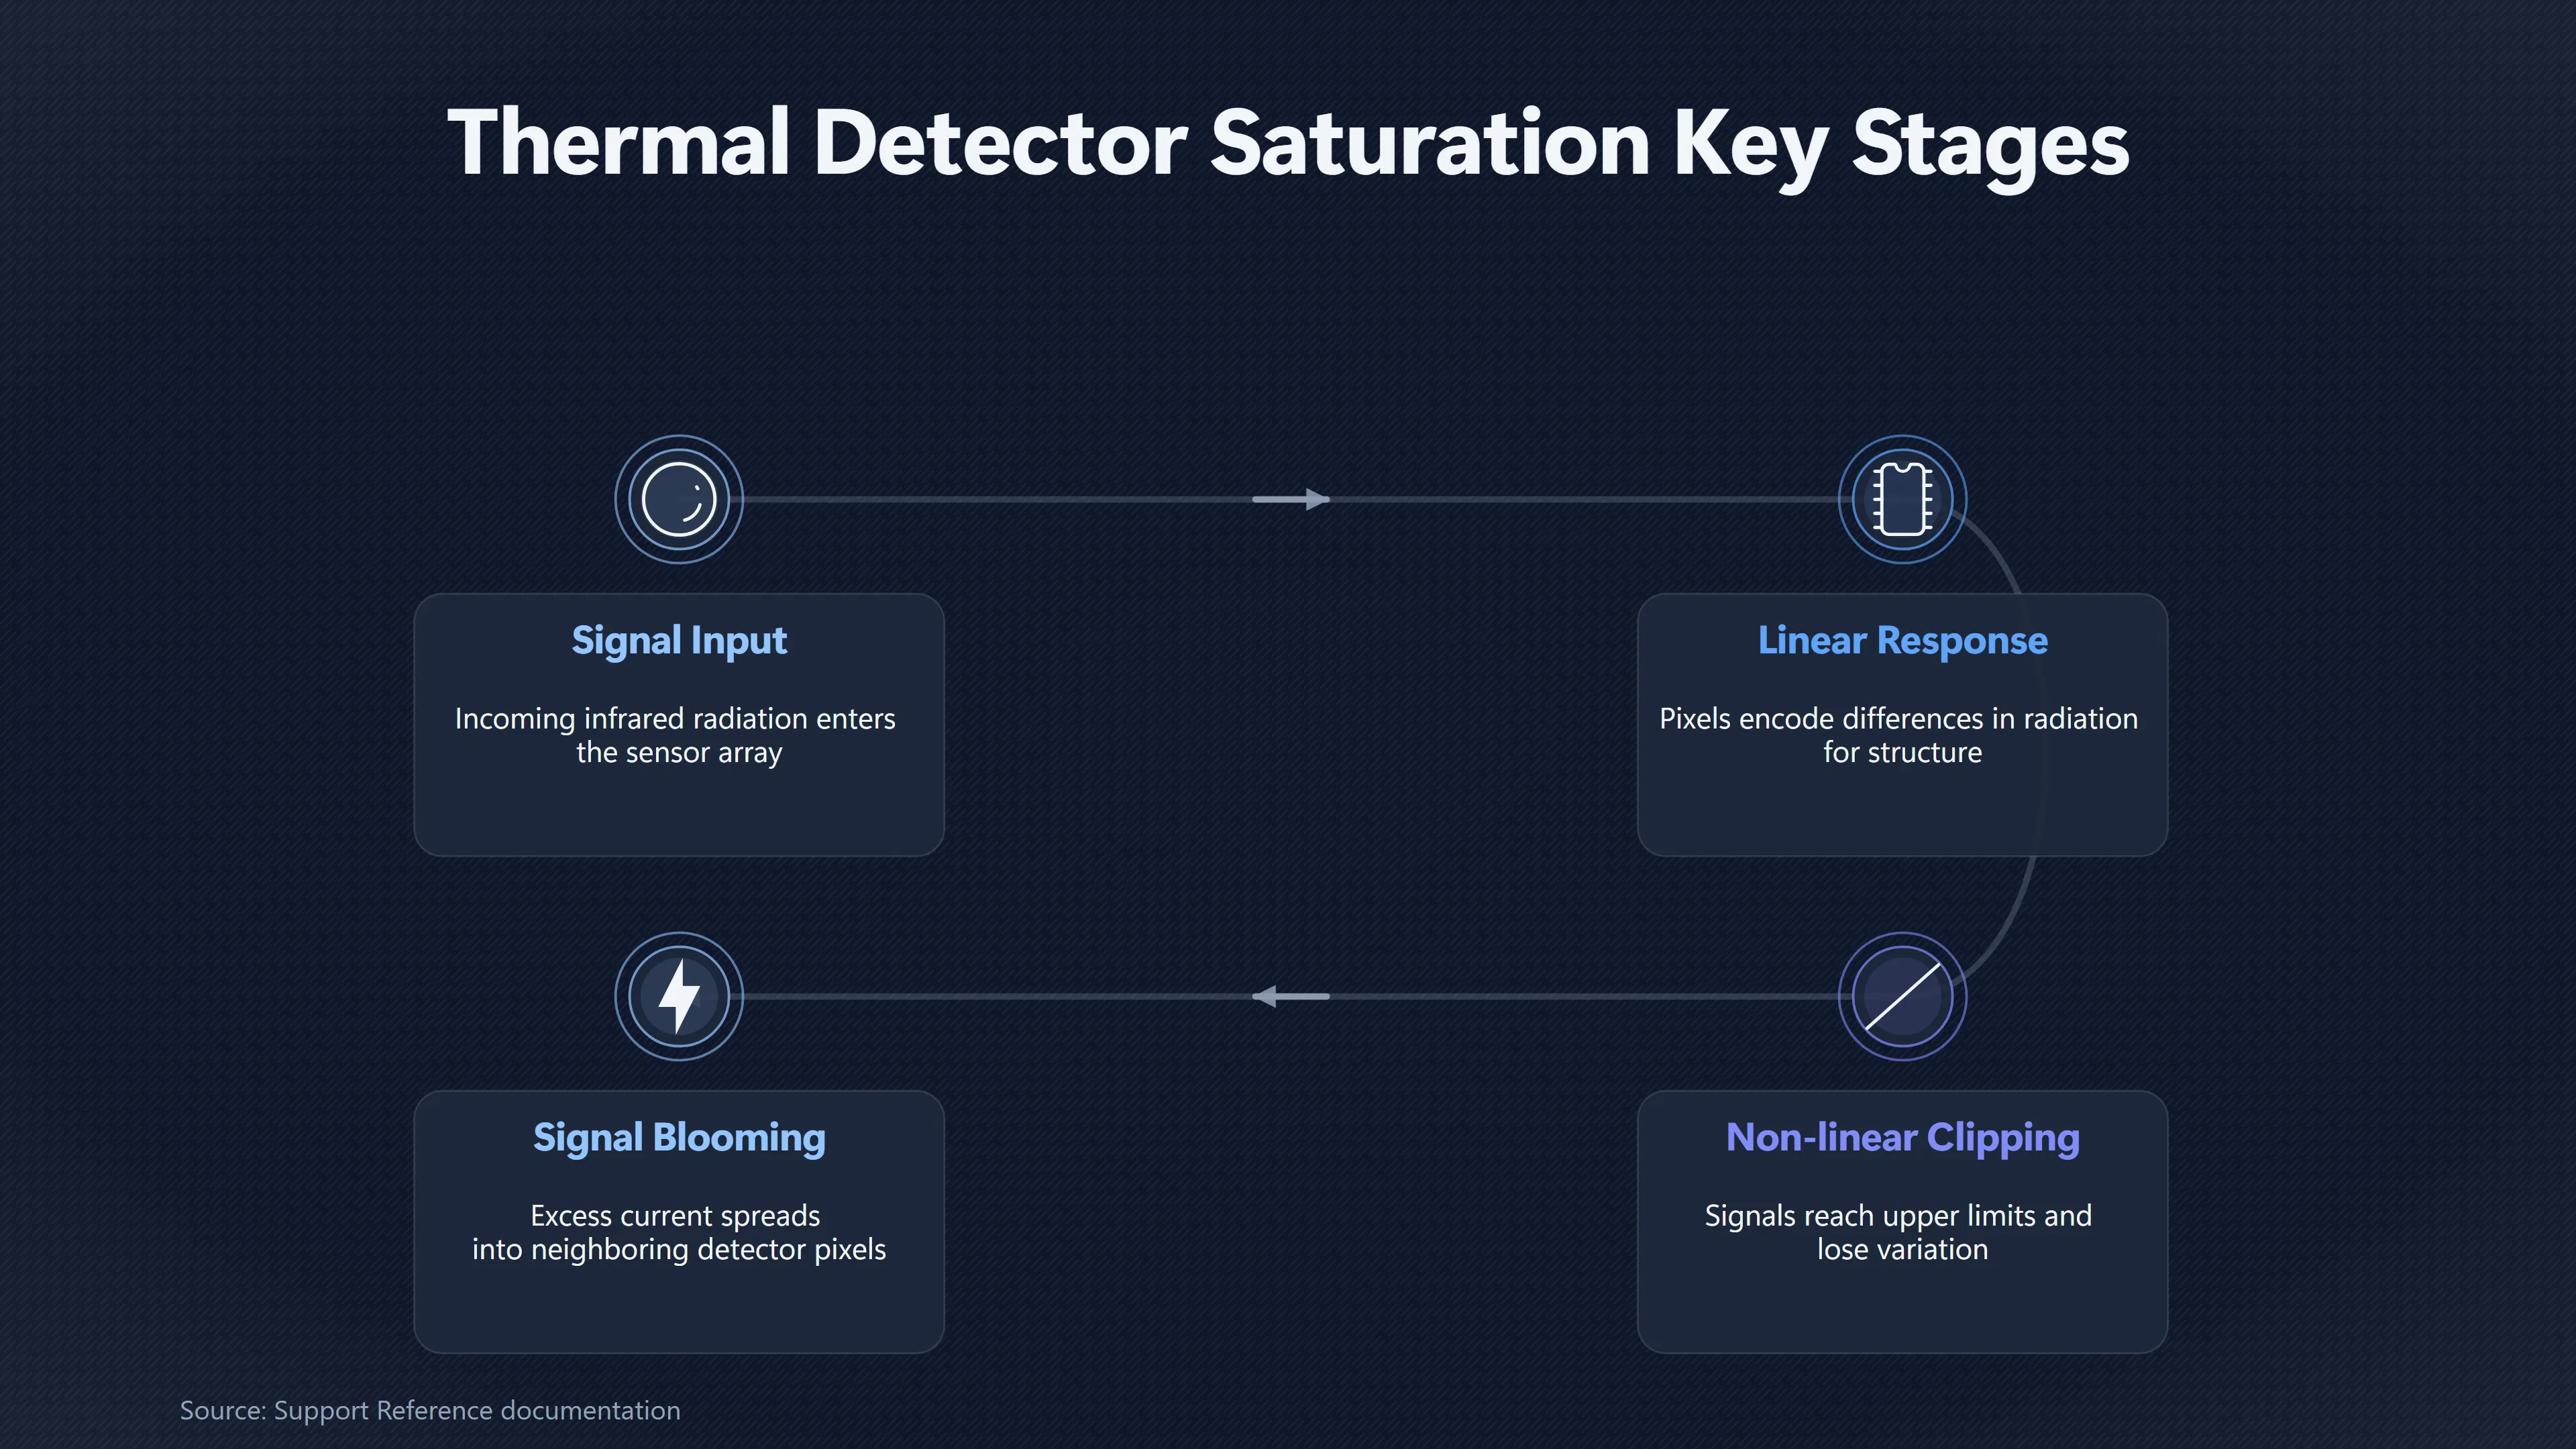
The practical result is straightforward. Below saturation, two neighbouring parts of a target producing different infrared radiances can produce different pixel values. Those differences contain information about structure. As the brightest pixels approach the upper limit, however, the response becomes non-linear and eventually clips. Radiation can keep increasing without the recorded value preserving the corresponding increase.
This is why selecting the correct operating range matters even on ordinary commercial thermal cameras. FLIR’s technical guidance says that selecting too low a temperature range produces an oversaturated image because hotter objects emit more infrared radiation than the selected range can accommodate. It recommends choosing a range that includes the hottest object in the image; some cameras explicitly mark overdriven areas.[FLIR Support]support.flir.comSupport Reference documentationFLIR SupportReference documentationApril 18, 2026…
The principle is not peculiar to one manufacturer’s equipment. A 2016 system-level study of thermal imagers notes that infrared detectors have a maximum allowable input and become saturated when incoming infrared energy exceeds it. In the model examined by the researchers, sufficient saturation could prevent the system from distinguishing target from background.[KCI]kci.go.krKCI열상장비의 포화 현상에 대한 시스템 모델링KCI열상장비의 포화 현상에 대한 시스템 모델링
That does not mean every bright infrared target is saturated. Nor does it mean saturation necessarily destroys the whole image. It can be local: the hottest portion of a target may clip while cooler pixels remain usable. The analytical problem is therefore not simply to ask whether an object looks bright, but whether the pixels being used to infer its shape remain within the camera’s useful response range.
Why brightness survives after shape information fails
Saturation creates a counter-intuitive situation: the camera can retain very strong evidence that something bright is there while losing some of the information needed to determine what shape it is.
Imagine three adjacent parts of a distant target producing progressively stronger detector signals. Within the linear operating range, they might be represented by values such as 180, 220 and 250 on a hypothetical scale. Their differences survive. If all three exceed the maximum representable level, however, they can collapse to essentially the same maximum value. The target remains intensely conspicuous, but distinctions within its brightest region disappear.
US Department of Homeland Security guidance for thermal imagers describes the operational version of this effect: objects outside the instrument’s dynamic range can appear at the same intensity, while extensive thermal saturation causes loss of contrast and a whiter, more featureless image.[Department of Homeland Security]dhs.govOpen source on dhs.gov.
That distinction between signal strength and recoverable structure is particularly important when interpreting distant targets. Shape identification depends heavily on spatial variations: where a wing meets the background, where a fuselage narrows, or where one hot component differs from another. Clipping replaces potentially different measurements with the same ceiling value. A bright patch can therefore remain easy to detect even as some of its discriminating information disappears.
Experimental work on target identification supports the broader point. Research examining saturation in enhanced long-wave infrared imagery found that once images became saturated, information useful for distinguishing targets was reduced and identification performance suffered. Crucially, the lost information included spatial cues used to distinguish one target shape from another.[ResearchGate]researchgate.netOpen source on researchgate.net.
A 2026 SPIE study approaches the same problem from the reconstruction side. Its authors describe strong infrared target radiation exceeding a detector’s quantisation capability, producing saturated, distorted pixel intensities and loss of reliable information needed for feature extraction and recognition. Their need to mathematically reconstruct saturated point targets illustrates the underlying limitation: once the original measurement has clipped, the missing signal distribution cannot simply be read back from the displayed bright core.[SPIE Digital Library]spiedigitallibrary.orgOpen source on spiedigitallibrary.org.
Saturation can also make the outline grow
Simple clipping is only part of the risk. Some infrared focal-plane arrays can exhibit blooming, in which saturation affects neighbouring pixels. This matters directly to outline interpretation because it can make a strong source occupy more detector area than its unsaturated image would.
Sandia National Laboratories researchers experimentally characterised point-spread behaviour, saturation and blooming in a mercury-cadmium-telluride infrared focal-plane array. Their tests projected controlled infrared spots onto the detector while varying position and intensity. For the tested arrays, which lacked anti-blooming circuitry, cross-talk increased once illumination rose beyond that required for analogue saturation.[Sandia National Laboratories]sandia.govSandia National LaboratoriesSimulation and experimental characterization of the point spread function, pixel saturation, and blooming of…
Later laboratory work on HgCdTe infrared detector arrays found a related saturation behaviour in which a saturated pixel shared current with neighbouring pixels, explicitly causing the brightest sources to appear “fatter”. Measurements across several arrays found that the shared current could exceed 60% of the photocurrent arriving at the saturated pixel.[University of Arizona]experts.arizona.eduUniversity of ArizonaBlooming in H2RG arrays: Laboratory measurements of a second brighter-fatter type effect in HgCdTe infrared detector…
These experiments should not be indiscriminately transferred to every thermal camera: detector technologies, readout circuits and anti-blooming measures differ. They establish the narrower and more important point that a saturated infrared footprint is not automatically confined to the geometrical pixels illuminated by the source.
For UAP interpretation, this creates a specific failure mode. If a distant aircraft’s strongest infrared feature is unresolved or nearly unresolved, saturation and detector spreading can enlarge that feature until it masks weaker structural cues. The displayed luminous region can then become rounder, thicker or less articulated than the underlying aircraft. Treating the boundary of that region as a measured hull boundary would reverse the logic of the imaging process: it would interpret a detector limit as object geometry.
Clues that a displayed edge is not physical
No single visual symptom proves saturation from compressed footage alone. A careful analysis instead looks for several mutually reinforcing signs and, wherever possible, checks them against raw sensor data and camera metadata.
Flat-topped intensity values are the strongest direct clue. In radiometric or sufficiently high-quality digital data, a cluster of pixels repeatedly reaching the same maximum value is much more informative than merely seeing a white-looking region. Display palettes can make perfectly valid measurements look white, so appearance alone is insufficient.
Internal thermal structure disappearing while the target stays conspicuous is suspicious. Saturation removes differences among signals that have crossed the ceiling. A region can therefore become unusually uniform even though its total apparent brightness remains extreme. DHS guidance’s description of saturated thermal scenes as losing contrast and becoming featureless captures this general behaviour.[Department of Homeland Security]dhs.govOpen source on dhs.gov.
The outline changing when the camera changes range or gain is another warning. Thermal cameras commonly use different operating ranges or sensitivity modes because one detector setting cannot optimise every possible scene. FLIR documentation demonstrates that selecting an inappropriate temperature range can produce over- or under-driven imagery, while DHS notes that fire-service thermal imagers may switch sensitivity modes according to scene heat and the proportion of affected pixels.[FLIR Support]support.flir.comSupport Reference documentationFLIR SupportReference documentationApril 18, 2026… A supposed physical boundary that changes markedly across such transitions deserves caution.
Apparent growth with increasing signal can indicate blooming or threshold effects. Laboratory infrared-detector measurements show that saturation can produce neighbour interactions and make bright sources appear fatter.[Sandia National Laboratories]sandia.govSandia National LaboratoriesSimulation and experimental characterization of the point spread function, pixel saturation, and blooming of… If the target’s bright footprint expands as intensity increases without independent evidence of an equivalent geometrical expansion, the displayed edge cannot safely be assumed to trace solid structure.
An out-of-range indication is especially important. Some commercial thermal cameras explicitly report temperatures above their calibrated range rather than pretending to measure them precisely; FLIR, for example, documents cameras that display an over-range indication when a scene exceeds the applicable measurement ceiling.[FLIR]flir.comWhat is the highest object temperature the FLIR K series can see? | FlirWhat is the highest object temperature the FLIR K series can see? | Flir That is an obvious reminder that the maximum displayed category is not a measurement of how far above the limit the source really lies.

What saturation does not prove
There is an important limit to the argument. Seeing a smooth infrared blob does not, by itself, prove that saturation caused it. An unresolved target, optical blur, atmospheric effects, image scaling, compression and subsequent processing can also suppress structural detail. Conversely, a source can be extremely bright on a displayed palette without the detector itself being saturated.
The technically defensible claim is narrower: once saturation is established or strongly suspected, the saturated portion of the image should not be treated as reliable shape evidence without further validation. Saturation establishes a ceiling in measured intensity; blooming can additionally alter spatial extent. Both mechanisms weaken the inference that the boundary visible on screen is the boundary of the physical object.
This is also why attenuating an excessive signal is a recognised engineering remedy. FLIR advises using an appropriate neutral-density filter when radiation would otherwise exceed a thermal imager’s saturation limit, reducing the signal before it reaches the sensor.[FLIR Customer Support]flir.custhelp.comFLIR Customer Support FLIR CamerasFLIR Customer SupportFLIR Cameras - Saturation Limit of a Thermal ImagerOctober 7, 2024… In experimental infrared spectroscopy, researchers have similarly used progressively stronger optical attenuation to determine whether apparent measurements were being corrupted by detector saturation.[arXiv]arxiv.orgOpen source on arxiv.org. The principle is revealing: if reducing incoming radiation restores trustworthy information, the original extreme brightness was not simply giving a “better view” of the source.
The UAP identification risk
For infrared UFO or UAP footage, the most consequential mistake is to reason backwards from a clipped image: the recording shows a smooth oval or orb, therefore the physical object was a smooth oval or orb. Saturation breaks that inference.
A camera can simultaneously provide good evidence for the presence and approximate location of a strong infrared source and poor evidence for its exact silhouette. Laboratory detector research shows that saturation can alter both recorded intensity and, under some detector conditions, apparent spatial extent. Thermal-imaging guidance shows that exceeding the usable range destroys contrast rather than revealing additional detail. Target-identification research shows that saturated imagery loses precisely the spatial information observers need for recognition.[sandia.gov]sandia.govSandia National LaboratoriesSimulation and experimental characterization of the point spread function, pixel saturation, and blooming of…
The appropriate evidential question is therefore not simply “What shape is the bright patch?” It is “Was the imaging system still capable of measuring that boundary faithfully?” Answering that requires information about detector type, operating range or gain, pixel values, processing, angular resolution and ideally unsaturated frames of the same target. Without those checks, a crisp-looking edge around a saturated infrared blob may be an edge produced by the sensor and display chain rather than a measured outline of an extraordinary object.
Amazon book picks
Further Reading
Books and field guides related to When Infrared Saturation Erases the Real Shape. Use these as the next step if you want deeper reading beyond the article.
Infrared Thermal Imaging: Fundamentals, Research and Applicat...
This richly illustrated hands-on guide is designed for researchers, teachers and practitioners. The huge selection of examples taken from...
Infrared Detectors and Systems
Infrared Detectors and Systems offers a deep and detailed examination of the optical detection process and the electronics of mimicking t...
Introduction to Infrared and Electro-Optical Systems
This newly revised and updated edition offers a current and complete introduction to the analysis and design of Electro-Optical (EO) imag...
eBay marketplace picks
Marketplace Samples
Live-tested eBay searches with available results related to this page.
Selected fromUFO poster oneBay.co.uk.

Current eBay listing
I Want To Believe UFO Poster Giclée Fine Art Heavyweight Print

Current eBay listing
VINTAGE UFO FLYING SAUCERS COMIC ADVERTISING A2 POSTER PRINT


Endnotes
1.
Source: dhs.gov
Link:https://www.dhs.gov/sites/default/files/2025-07/25_0721_thermalimagersmsr.pdf
2.
Source: sandia.gov
Link:https://www.sandia.gov/research/publications/details/simulation-and-experimental-characterization-of-the-point-spread-function-p-2012-11-20/
Source snippet
Sandia National LaboratoriesSimulation and experimental characterization of the point spread function, pixel saturation, and blooming of...
3.
Source: experts.arizona.edu
Link:https://experts.arizona.edu/en/publications/blooming-in-h2rg-arrays-laboratory-measurements-of-a-second-brigh/
Source snippet
University of ArizonaBlooming in H2RG arrays: Laboratory measurements of a second brighter-fatter type effect in HgCdTe infrared detector...
4.
Source: support.flir.com
Title: Support Reference documentation
Link:https://support.flir.com/DSDownload/Assets/T810442-en-US_A4.pdf
Source snippet
FLIR SupportReference documentationApril 18, 2026...
Published: April 18, 2026
5.
Source: flir.com
Title: TECHNICAL NOTE | — | —The secret to a good thermal image
Link:https://www.flir.com/contentassets/b6112afa642447c0b424d933ce112f62/secret-to-good-thermal-image.pdf/
Source snippet
TECHNICAL NOTE | --- | ---The secret to a good thermal image...
6.
Source: researchgate.net
Link:https://www.researchgate.net/publication/271494024_Limitations_of_contrast_enhancement_for_infrared_target_identification
7.
Source: flir.com
Title: What is the highest object temperature the FLIR K series can see? | Flir
Link:https://www.flir.com/support-center/instruments2/what-is-the-highest-object-temperature-the-flir-k-series-can-see/
8.
Source: arxiv.org
Link:https://arxiv.org/abs/2012.14987
9.
Source: apfs-cloud.dhs.gov
Title: public print
Link:https://apfs-cloud.dhs.gov/record/73421/public-print/
10.
Source: flir.com
Link:https://www.flir.com/en-gb/discover/instruments/gas-detection/advancement-in-methane-emissions-measurement-using-quantitative-optical-gas-imaging-qogi-technology/
11.
Source: researchgate.net
Title: (PDF) Thermodynamic and thermal perspectives of failure in oscillating heat pipe
Link:https://www.researchgate.net/publication/396430227_Thermodynamic_and_thermal_perspectives_of_failure_in_oscillating_heat_pipe
12.
Source: dhs.gov
Title: Good Liquid, Bad Liquid | Homeland Security
Link:https://www.dhs.gov/science-and-technology/good-liquid-bad-liquid
13.
Source: dhs.gov
Link:https://www.dhs.gov/publications-library/collections/dhs-patented-technologies?page=2
14.
Source: dhs.gov
Title: S T-Night Vision Technologies: Image Intensifiers | Homeland Security
Link:https://www.dhs.gov/science-and-technology/saver/night-vision-technologies-image-intensifiers
15.
Source: flir.com
Title: Infrared Camera Accuracy and Uncertainty in Plain Language | Flir
Link:https://www.flir.com/en-gb/discover/rd-science/infrared-camera-accuracy-and-uncertainty-in-plain-language/
16.
Source: oem.flir.com
Title: Comparing Sensitivity of Thermal Imaging Cameras Modules
Link:https://oem.flir.com/en-gb/learn/discover/Comparing-Sensitivity-of-Thermal-Imaging-Cameras-Modules/
17.
Source: flir.com
Title: Best Filtering Practices For Accurate Fired Furnace Tube Measurement | Flir
Link:https://www.flir.com/discover/industrial/best-filtering-practices-for-accurate-fired-furnace-tube-measurement/
18.
Source: flir.com
Title: Picking a Thermal Color Palette | Flir
Link:https://www.flir.com/en-eu/discover/industrial/picking-a-thermal-color-palette/
19.
Source: dhs.gov
Link:https://www.dhs.gov/science-and-technology/news/2020/11/23/news-release-dhs-st-requests-night-vision-technologies-market-survey
20.
Source: researchgate.net
Link:https://www.researchgate.net/publication/346728175_Multisensor_Characterization_of_the_Incandescent_Jet_Region_of_Lava_Fountain-Fed_Tephra_Plumes
21.
Source: flir.com
Title: Do You Need a High Temp Range TIC? | Flir
Link:https://www.flir.com/en-ca/discover/instruments/firefighting/do-you-need-a-high-temp-range-tic/
22.
Source: flir.ca
Title: uas radiometric temperature measurements
Link:https://www.flir.ca/discover/suas/uas-radiometric-temperature-measurements/
23.
Source: flir.com
Title: What is a Non-Uniformity Correction (NUC)? | Flir
Link:https://www.flir.com/discover/professional-tools/what-is-a-non-uniformity-correction-nuc/
24.
Source: flir.com
Title: Thermal Camera Specs You Should Know Before Buying | Flir
Link:https://www.flir.com/en-gb/discover/professional-tools/thermal-camera-specs-you-should-know-before-buying/
25.
Source: flir.eu
Title: thermal camera specs you should know before buying
Link:https://www.flir.eu/discover/professional-tools/thermal-camera-specs-you-should-know-before-buying/
26.
Source: researchgate.net
Link:https://www.researchgate.net/publication/329127606_Technical_note_Mapping_surface-saturation_dynamics_with_thermal_infrared_imagery?_tp=eyJjb250ZXh0Ijp7InBhZ2UiOiJzY2llbnRpZmljQ29udHJpYnV0aW9ucyIsInByZXZpb3VzUGFnZSI6bnVsbCwic3ViUGFnZSI6bnVsbH19
27.
Source: researchgate.net
Link:https://www.researchgate.net/publication/328180319_In-band_low-power_laser_dazzle_and_pixel_damage_of_an_uncooled_LWIR_thermal_imager
28.
Source: flir.com
Title: The Advantages of LWIR SLS Thermal Cameras | Flir
Link:https://www.flir.com/en-gb/discover/rd-science/the-advantages-of-lwir-sls-thermal-cameras/
29.
Source: researchgate.net
Link:https://www.researchgate.net/publication/233838496_Simulation_and_experimental_characterization_of_the_point_spread_function_pixel_saturation_and_blooming_of_a_mercury_cadmium_telluride_focal_plane_array
30.
Source: researchgate.net
Link:https://www.researchgate.net/publication/229361149_Discrimination_between_electronic_and_optical_blooming_in_an_InSb_focal-plane_array_under_high-intensity_excitation
31.
Source: oem.flir.com
Link:https://oem.flir.com/en-gb/support/support-center/knowledge-base/is-it-possible-to-image-an-object-or-scene-that-is-hotter-than-the-550-c-low-gain-scene-range-limit-of-tau2-or-quark2/
32.
Source: flir.com
Link:https://www.flir.com/en-gb/products/tg298/?segment=solutions&vertical=condition+monitoring
33.
Source: flir.com
Link:https://www.flir.com/en-gb/products/tg268/
34.
Source: flir.com
Link:https://www.flir.com/discover/instruments/you-cant-afford-to-forget-ford–3-things-to-remember-during-an-ir-inspection/
35.
Source: flir.com
Link:https://www.flir.com/en-gb/support/instruments2/what-is-the-maximum-power-density-from-an-object-that-the-camera-can-take/
36.
Source: flir.com
Link:https://www.flir.com/en-gb/products/a50_a70-image-streaming/?segment=solutions&vertical=science
37.
Source: flir.com
Link:https://www.flir.com/en-gb/products/a50_a70-image-streaming/?model=89895-3601
38.
Source: docs.flir.com
Link:https://docs.flir.com/T810587/en-US/latest/s11.html
39.
Source: flir.com
Link:https://www.flir.com/support-center/instruments2/what-is-the-maximum-power-density-from-an-object-that-the-camera-can-take/
40.
Source: flir.com
Link:https://www.flir.com/en-gb/browse/portable-inspection-solutions/handheld-thermal-cameras/tg-series/
41.
Source: flir.com
Link:https://www.flir.com/en-gb/products/tg298/
42.
Source: flir.com
Link:https://www.flir.com/browse/portable-inspection-solutions/handheld-thermal-cameras/tg-series/
43.
Source: flir.com
Link:https://www.flir.com/en-eu/browse/portable-inspection-solutions/handheld-thermal-cameras/tg-series/
44.
Source: flir.com
Link:https://www.flir.com/en-gb/support/instruments2/sometimes-when-a-temperature-is-out-of-range-i-get-a–in-the-image-to-show-this.-but-other-times-i-get-a–sign-instead.-can-someone-please-explain-the-difference
45.
Source: docs.flir.com
Link:https://docs.flir.com/T810579/en-US/latest/s18.html
46.
Source: researchgate.net
Link:https://www.researchgate.net/publication/363631635_Enabling_thermography_of_highly_reflective_laser_welds_using_a_multi-flash_sequence_approach
47.
Source: researchgate.net
Link:https://www.researchgate.net/publication/200118348_Simultaneous_extraction_of_geometry_and_surface_properties_of_targets_using_simple_infrared_sensors
48.
Source: flir.eu
Link:https://www.flir.eu/products/a6780-sls?segment=solutions&vertical=rd+science
49.
Source: library.imaging.org
Link:https://library.imaging.org/jist/articles/63/1
50.
Source: dhs.gov
Link:https://www.dhs.gov/medialibrary/assets/video/9286
51.
Source: cdp.dhs.gov
Title: las vegas metro pd learns extrication tactics
Link:https://cdp.dhs.gov/news-media/article/las-vegas-metro-pd-learns-extrication-tactics/
52.
Source: cdp.dhs.gov
Link:https://cdp.dhs.gov/shared/se/courses/default/AWR-923-W%2005122021%201.2-20210512144644/groups/349.html
53.
Source: cdp.dhs.gov
Link:https://cdp.dhs.gov/shared/se/courses/default/AWR-923-W%2005122021%201.2-20210512144644/groups/344.html
54.
Source: dhs.gov
Link:https://www.dhs.gov/medialibrary/assets/videos/22954
55.
Source: cdp.dhs.gov
Title: AWR 337
Link:https://cdp.dhs.gov/training/course/AWR-337
56.
Source: dhs.gov
Link:https://www.dhs.gov/medialibrary/assets/video/60277
57.
Source: flir.custhelp.com
Title: FLIR Customer Support FLIR Cameras
Link:https://flir.custhelp.com/app/answers/detail/a_id/3270/~/flir-cameras—saturation-limit-of-a-thermal-imager
Source snippet
FLIR Customer SupportFLIR Cameras - Saturation Limit of a Thermal ImagerOctober 7, 2024...
Published: October 7, 2024
58.
Source: pmc.ncbi.nlm.nih.gov
Link:https://pmc.ncbi.nlm.nih.gov/articles/PMC8472956/
Source snippet
PubMed Central (PMC)Thermal Imaging Metrology Using High Dynamic Range Near-Infrared Photovoltaic-Mode Camera - PMCSeptember 13, 2021...
Published: September 13, 2021
59.
Source: kci.go.kr
Title: KCI열상장비의 포화 현상에 대한 시스템 모델링
Link:https://www.kci.go.kr/kciportal/ci/sereArticleSearch/ciSereArtiView.kci?sereArticleSearchBean.artiId=ART002168917
60.
Source: spiedigitallibrary.org
Link:https://www.spiedigitallibrary.org/proceedings/Download?downloadType=proceedings+article&isResultClick=True&urlId=10.1117%2F12.3106170
61.
Source: pmc.ncbi.nlm.nih.gov
Link:https://pmc.ncbi.nlm.nih.gov/articles/PMC13210760/
62.
Source: electronicimaging.spiedigitallibrary.org
Link:https://electronicimaging.spiedigitallibrary.org/conference-proceedings-of-spie/14177/1417780/Infrared-dim-and-small-target-detection-algorithm-based-on-local/10.1117/12.3109686.full
63.
Source: flir.custhelp.com
Title: flir cameras sometimes when a temperature is out of range i get a star sign?
Link:https://flir.custhelp.com/app/answers/detail/a_id/488/~/flir-cameras—sometimes-when-a-temperature-is-out-of-range-i-get-a-star-sign%3F
64.
Source: spiedigitallibrary.org
Link:https://www.spiedigitallibrary.org/conference-proceedings-of-spie/14185/141850X/Measurement-of-infrared-radiation-characteristic-for-engine-exhaust-plume-based/10.1117/12.3114022.short
65.
Source: pmc.ncbi.nlm.nih.gov
Link:https://pmc.ncbi.nlm.nih.gov/articles/PMC12251710/
66.
Source: pubmed.ncbi.nlm.nih.gov
Link:https://pubmed.ncbi.nlm.nih.gov/40648278/
67.
Source: flir.custhelp.com
Title: camera temperature symbols on the screen
Link:https://flir.custhelp.com/app/answers/detail/a_id/6491/~/camera-temperature-symbols-on-the-screen
68.
Source: electronicimaging.spiedigitallibrary.org
Link:https://electronicimaging.spiedigitallibrary.org/journals/optical-engineering/volume-64/issue-09/092202/Infrared-small-target-detection-based-on-multi-scale-dense-network/10.1117/1.OE.64.9.092202.full
69.
Source: flir.custhelp.com
Title: flir uas how can i reduce halo effects or vignetting in my uas camera images?
Link:https://flir.custhelp.com/app/answers/detail/a_id/3495/~/flir—uas-how-can-i-reduce-halo-effects-or-vignetting-in-my-uas-camera-images%3F
70.
Source: nanolithography.spiedigitallibrary.org
Link:https://nanolithography.spiedigitallibrary.org/conference-proceedings-of-spie/13493/1349309/Simulation-of-infrared-radiation-characteristics-and-dynamic-imaging-of-space/10.1117/12.3046093.full
71.
Source: pmc.ncbi.nlm.nih.gov
Link:https://pmc.ncbi.nlm.nih.gov/articles/PMC11569156/
72.
Source: bhxb.buaa.edu.cn
Link:https://bhxb.buaa.edu.cn/bhzk/en/article/doi/10.13700/j.bh.1001-5965.2023.0349
73.
Source: pmc.ncbi.nlm.nih.gov
Link:https://pmc.ncbi.nlm.nih.gov/articles/PMC10382065/
74.
Source: spiedigitallibrary.org
Link:https://www.spiedigitallibrary.org/conference-proceedings-of-spie/12106/1210606/Target-discrimination-in-the-extended-SWIR-eSWIR-band-2-25%C2%B5m/10.1117/12.2618566.short
75.
Source: pmc.ncbi.nlm.nih.gov
Link:https://pmc.ncbi.nlm.nih.gov/articles/PMC8914959/
76.
Source: pmc.ncbi.nlm.nih.gov
Link:https://pmc.ncbi.nlm.nih.gov/articles/PMC7362298/
77.
Source: pmc.ncbi.nlm.nih.gov
Link:https://pmc.ncbi.nlm.nih.gov/articles/PMC6696215/
78.
Source: pmc.ncbi.nlm.nih.gov
Link:https://pmc.ncbi.nlm.nih.gov/articles/PMC7514725/
79.
Source: publications.drdo.gov.in
Link:https://publications.drdo.gov.in/ojs/index.php/dsj/article/view/5768
80.
Source: nanophotonics.spiedigitallibrary.org
Link:https://nanophotonics.spiedigitallibrary.org/journalIssue/Download?downloadType=journal+article&isResultClick=True&urlId=10.1117%2F1.3498782
81.
Source: spiedigitallibrary.org
Title: Improved target detection by IR dual-band image fusion
Link:https://www.spiedigitallibrary.org/conference-proceedings-of-spie/7481/1/Improved-target-detection-by-IR-dual-band-image-fusion/10.1117/12.832294.full
82.
Source: spiedigitallibrary.org
Link:https://www.spiedigitallibrary.org/proceedings/Download?fullDOI=10.1117%2F12.785559
83.
Source: proceedings.spiedigitallibrary.org
Link:https://proceedings.spiedigitallibrary.org/journalIssue/Download?downloadType=journal+article&isResultClick=True&urlId=10.1117%2F1.1578084
84.
Source: proceedings.spiedigitallibrary.org
Link:https://proceedings.spiedigitallibrary.org/journalIssue/Download?downloadType=journal+article&isResultClick=True&urlId=10.1117%2F1.1531637
85.
Source: spiedigitallibrary.org
Title: Volume 30 Issue 11 | Optical Engineering
Link:https://www.spiedigitallibrary.org/journalIssue/Download?urlId=10.1117%2F12.55998
86.
Source: pubmed.ncbi.nlm.nih.gov
Link:https://pubmed.ncbi.nlm.nih.gov/20309345/
87.
Source: sciencedirect.com
Title: Thermal Imager
Link:https://www.sciencedirect.com/topics/engineering/thermal-imager
88.
Source: pubmed.ncbi.nlm.nih.gov
Link:https://pubmed.ncbi.nlm.nih.gov/17361303/
Additional References
89.
Source: nature.com
Link:https://www.nature.com/articles/s41598-026-61438-1
90.
Source: osti.gov
Link:https://www.osti.gov/pages/biblio/1323900
91.
Source: osti.gov
Link:https://www.osti.gov/pages/biblio/1803549
92.
Source: osti.gov
Link:https://www.osti.gov/pages/biblio/1874544
93.
Source: usgs.gov
Link:https://www.usgs.gov/landsat-missions/detector-striping
94.
Source: osti.gov
Link:https://www.osti.gov/biblio/2281594
95.
Source: osti.gov
Link:https://www.osti.gov/biblio/1782176
96.
Source: osti.gov
Link:https://www.osti.gov/biblio/1464592
97.
Source: usgs.gov
Link:https://www.usgs.gov/landsat-missions/oversaturation
98.
Source: osti.gov
Link:https://www.osti.gov/biblio/22308507